Mapping Alcohol and Urban Vice in the 19th Century
Making space legible and territories calculable is central to modern forms of governmentality. One important tool of those rationalities and practices are maps. While maps played a crucial role for giving the emerging nation states and their colonies their clear boundaries, for organizing people, goods, and property, the rise of thematic maps in the 19th introduces maps as tools for spatializing the social and for seeing the social through spatial means. Those maps and the act of mapping help to bring a spatial and visual order into the ever-growing amount of data and datafied knowledge that becomes available with the rise of modern statistics, the modern state, and the emerging social sciences.
Since their popularization in the 19th century, thematic maps have been widely used to map what bourgeois authors perceived as social ills and moral lapses of the present. In particular, the rapidly growing cities in Europe and North America and the social change associated with them, seemed to these authors to be problematic places associated with problematic behaviour and populated by problematic people. Alcohol was high on the list of these urban vices especially alcohol that was consumed in public or semi-public spaces and by members of the growing working-class. A central agent in these regards were the temperance movement and social reformers within the emerging empirical social sciences.
Allegoric Maps
The earliest temperance maps of alcohol and drunkenness are not maps in the modern and cartographic sense and they are also not really about the urban as a site of the social. Instead, they are allegoric maps and cities are merely the names for spatialized concepts. Those allegoric maps draw on a rich history of a metaphorical use of the map’s proposition about things and places. Even though not geographic maps themselves, they gain their power and traction from the authority and self-certainty of maps that “impart to maps a certainty and truthfulness lacking in other texts” (Edney 2019, p. 95) and that make maps such a popular instrument of satire (Edney 2019, 11).
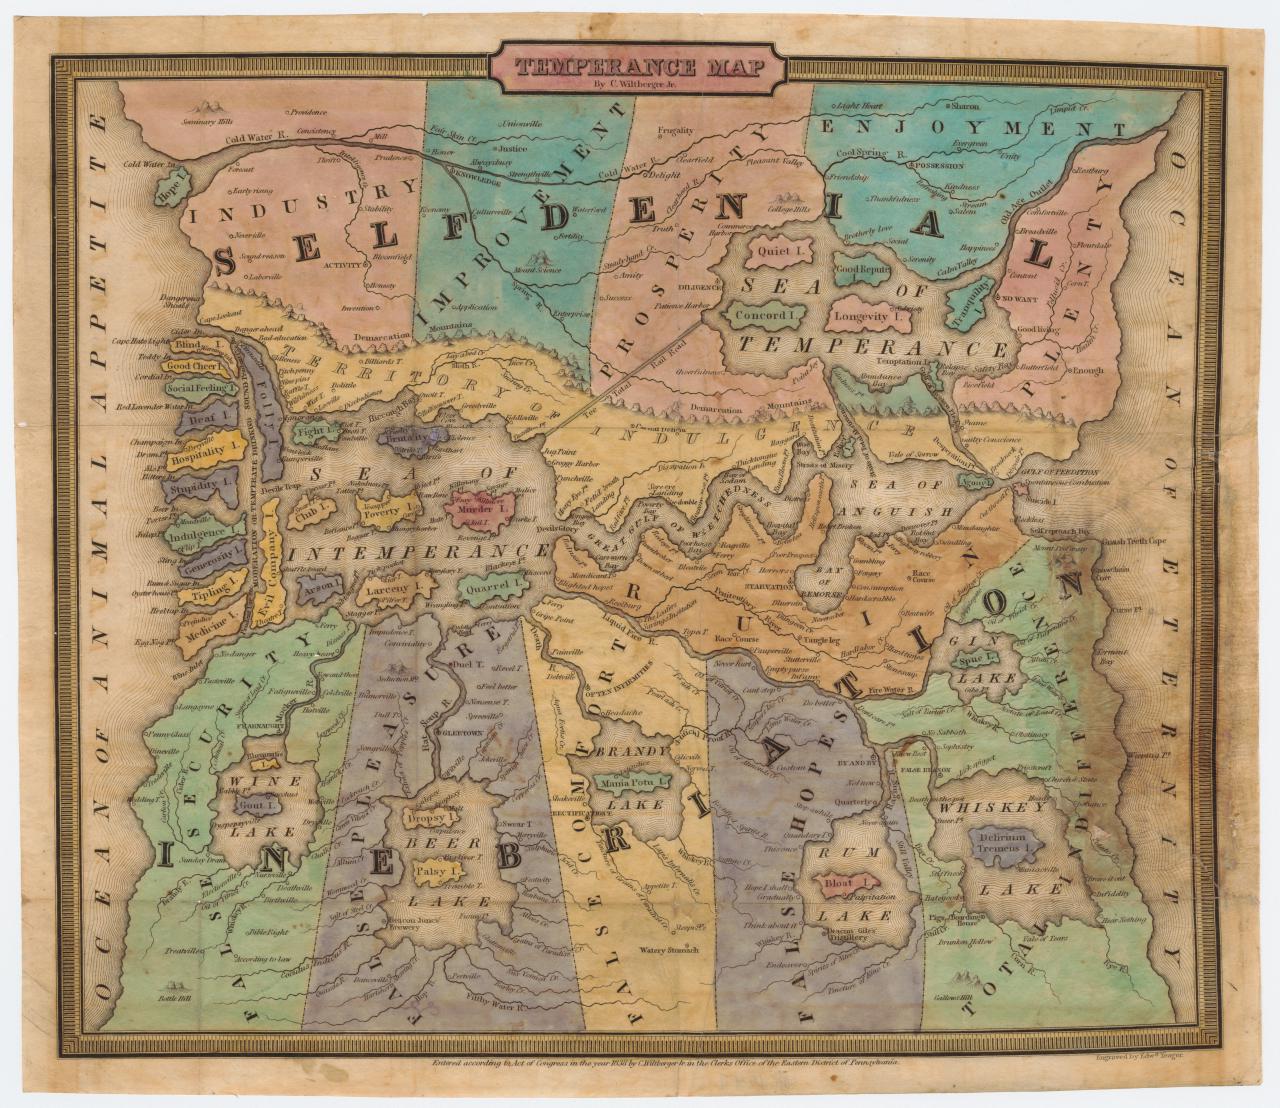
This map by Reverend John Christian Wiltberger (Wiltberger 1838) is one of the earliest and most well-known cartographic representations of alcohol in the first half of the 19th century and it inspired a number less artistic imitations over the following decades. Printed in 1838, this allegoric map depicts the two imaginary continents of Inebriation and Selfdenial. As Susan Schulten writes, this map “invite[s] readers to navigate sin and temptation” (Schulten 2018, p. 126) and thereby helps them to find their way to righteousness. The map offers abundant details and teaches restrain and abstinence: While in the west one encounter the islands of Good Cheer, Hospitality and Medicine, that quickly leads to the Sea of Intemperance. Happiness and a good life can only be archived through staying in the lands of Selfdenial, were the towns of Fertility and Enterprise can be found at the foot of Mount Science in the State of Improvement. South of the Sea of Intemperance and the Great Gulf of Wretchedness are the lands of False Hopes, the Beer Lake and the Bay of Remorse.
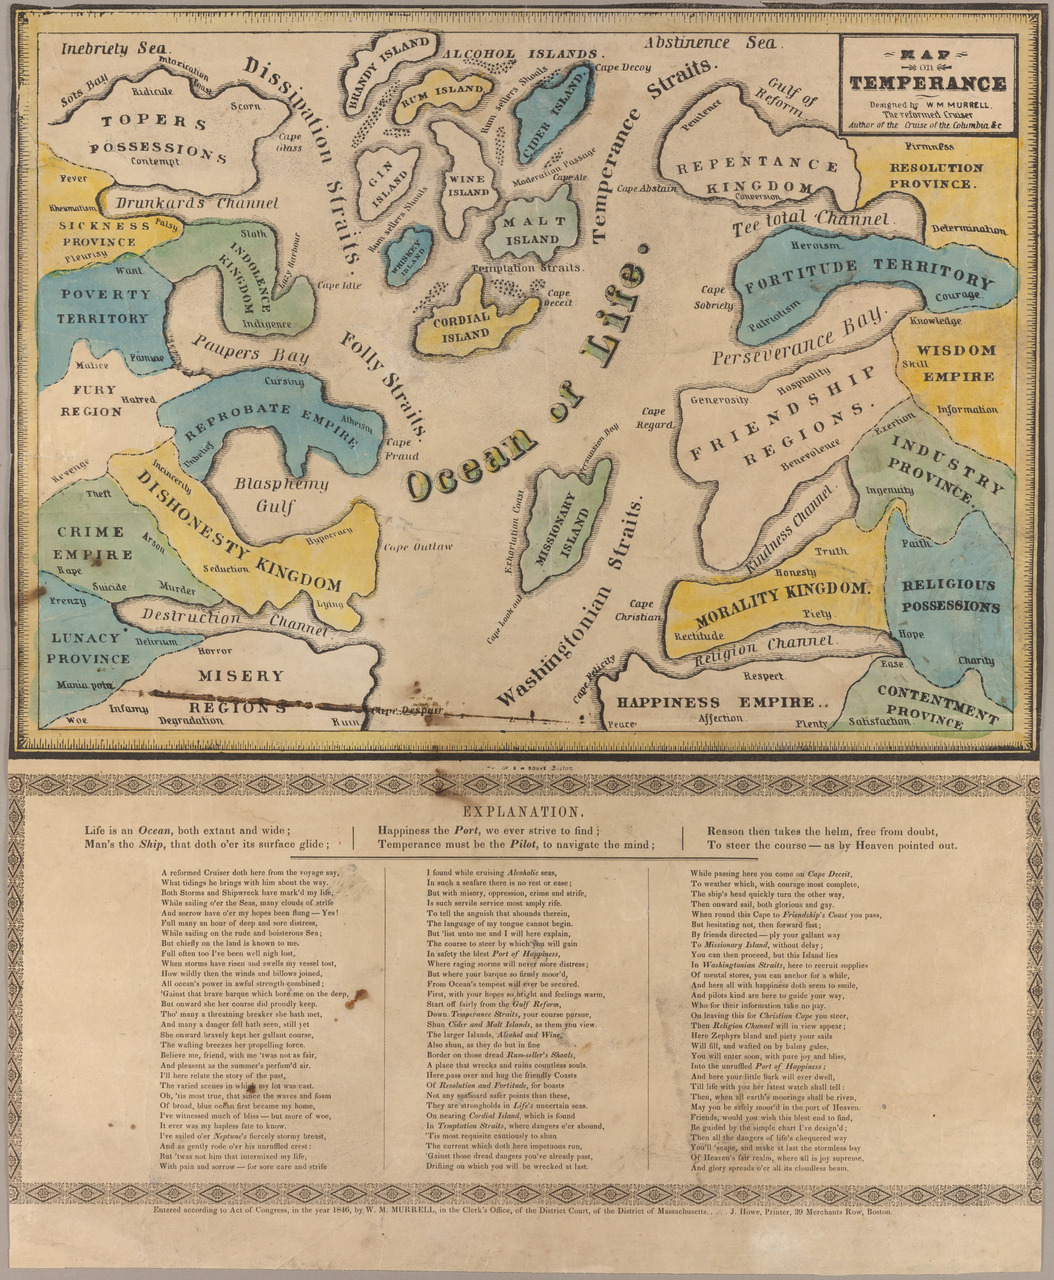
While this 1838 map is surly extraordinary, it is by no means the only allegoric map of the 19th century temperance movement. A couple of years earlier, “The Temperance Almanac”, published by the New-York State Temperance Society, contained a very similar map showing the abstinent Continent of Plenty and the intemperate Continent of Poverty (New-York State Temperance Society 1835). Another example is William Meacham Murrells “Map on Temperance” (Murrell 1846), printed in 1846. The overall appeal and argument are similar to Wiltberger’s earlier map. “The Ocean of Life” in the centre of the map is surrounded by two larger landmasses as well as a group of islands. Heroism and Patriotism as well as Honesty and Happiness Empire are on the continent of abstinence and temperance whereas the city of Murder, Paupers Bay and Lazy Harbour reside west of the Folly Straits. While this map is less artistic and offers less details than Wiltberger’s map, this map is accompanied by a long explanatory poem. In the poem the reader learns that “Life is an Ocean” and “man’s is the Ship” and follows the author, who a few years earlier published a book on his time as a crew member at sea (Murrell 1840), on his voyage from the “Alcoholic seas” to heaven and glory (Gin Lum 2014, p. 90).
These allegoric maps are primarily educational. For example, the 1835 “Temperance Almanac” writes: “we recommend parents to explain it to their children during the long winter evenings” (New-York State Temperance Society 1835, p. 29) and the whole almanac is about teaching abstinence. Their spatial reference is of course metaphorical, drawing its suggestive power from the trust put into maps and their ability to visually proving that “this is there” and “this is close to that” (Wood and Fels 2008). One could argue that these maps are not merely illustrative graphics and at least some of those maps are also accompanied by the written description of the itinerary through these continents. Neither are those maps only descriptive of an imaginary/metaphorical territory. The route to be taken becomes prescriptive and as the map is a trustworthy navigational tool, the path from the occasional drink to doom becomes a necessity.
It becomes clear, that drunkenness to these maps is not a social problem but one of individual decisions, of taking one wrong turn. Thus, the allegoric maps speak to the individual reader as a temperate subject or as a subject in need of guidance.
Mapping Alcohol in Urban Space
Proper geographical and cartographic maps of alcohol and the city do not emerge before drinking becomes a social problem. If alcoholism was an issue of the individual mind and a decision of “habitual drinking”, the actual urban space offered less explanation and less of an urgency than if drinking becomes seen as a social problem and as a problem that takes place in a social context. Then, as Vaughan writes, it “was a logical move to start to map the location of the problem in its urban context, which explains the proliferation of drink maps during this period, whose cartography represented alcohol ‘as a spatial problem’” (Vaughan 2018, p. 178). From the second half of the nineteenth century on, “temperance activists and others found that mapping drink outlets allowed them to identify areas where alcohol consumption might be concentrated” (Kneale and French 2008, p. 234) and could thereby be brought to public attention. Especially if those maps could count on the suggestive power of large numbers.
Map Shewing the Number of Public Houses in the Metropolis1859
Map of Public Houses in London
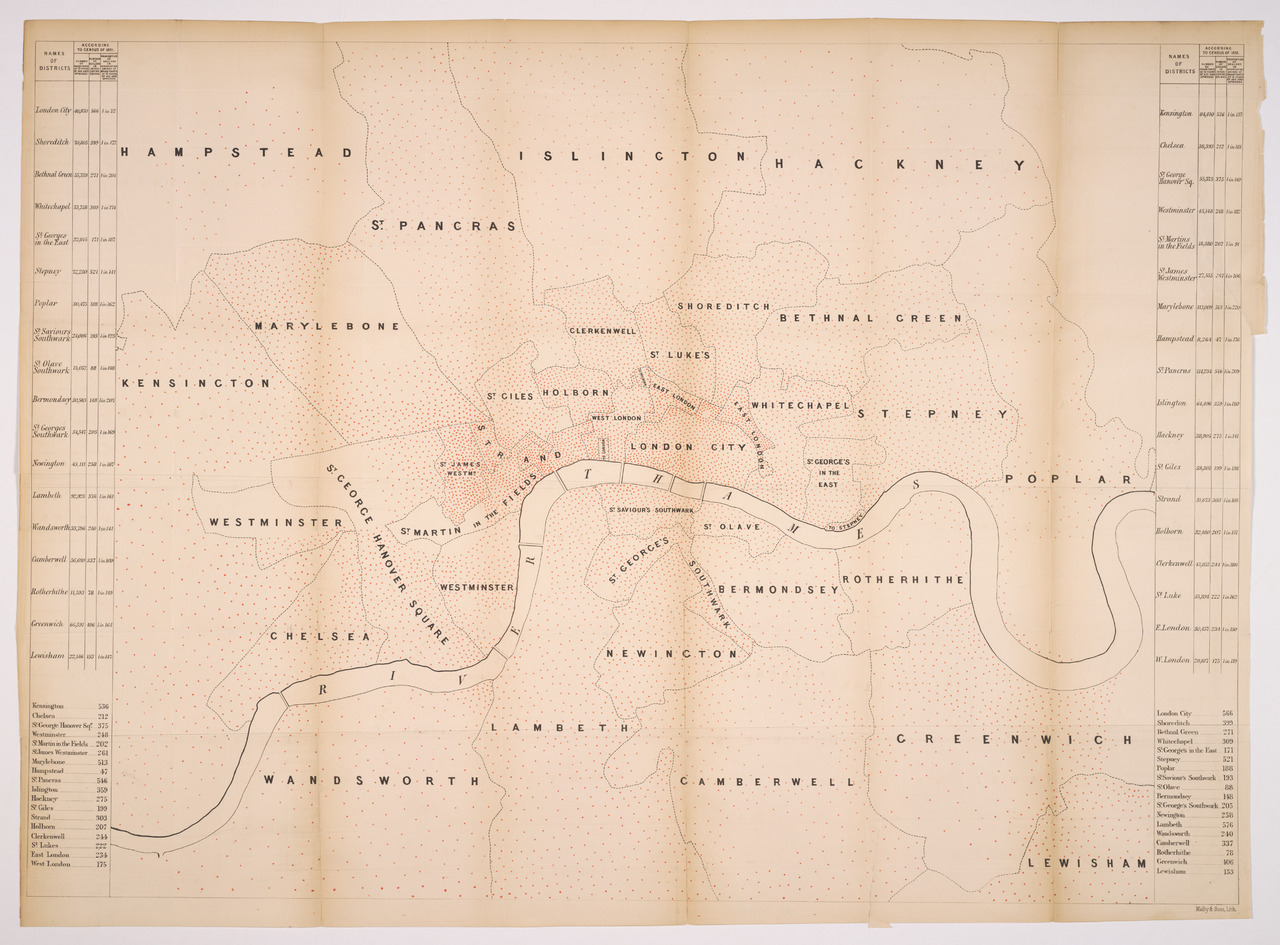
John TaylorThe “Map Shewing the Number of Public Houses in the Metropolis” (Taylor 1859) was published roughly at the same time that John Snow published his now famous Cholera map that argued for the theory of water borne transmission of the disease and against the dominant paradigm of miasma (Snow 1855). Both maps make visual arguments about London and threats to its health and both maps use points to indicate the distribution of a phenomenon – a technique that was applied in most of the earlier disease maps. Snows map is often credited for being one of the first maps that proof a theory by juxtaposing two variables – deadly cases of Cholera and the location of a water pump. John Taylor’s map locates places where intoxicating liquor is sold. While not explicitly stated in the accompanying text (Taylor 1860) it is probably not the location of individual places that is mapped but the number of places per district with some and the map is thus rather a dot-density map than a dot map. Overall, the map shows more than ten thousand red dots unevenly distributed over London’s districts. The number of those places is then related to the adult population of the given district, producing tables on the margins of the map, showing the “Proportion of dealers in intoxicating drinks of inhabitants at 15 years of age and upwards”, ranging from one public house for every 72 inhabitants in the City of London to somewhere in the lower 200s in places like Bethnal Green or Marylebone.
Taylor’s map was presented as a vital part of a paper presentation about the connection between alcohol and crime (Taylor 1860) the author gave in the name of the National Temperance League in 1860 before the National Association for the Promotion of Social Science. Framed within the discourse of Christian philanthropy, the paper “Drunkenness, an indirect cause of Crime” not only links “intemperance” to crime and sees alcohol as a root-cause of poverty, “utter degradation” and “loss of character” of people “generally belong[ing] to the dangerous classes” but also frames it as a threat to national progress and economic development (Taylor 1860, pp. 5–6). Given, that the last census of Great Britain saw more “dealers of intoxicating liquors” than bakers or grocers, the paper argues legislative action by the Parliament has to be taken in order to prevent the further spread of “facilities for the sale or purchase of intoxicating drinks.” (Taylor 1860, p. 4). The map, Taylor writes, helps to “illustrate the condition of England as well as the metropolis” (Taylor 1860, p. 4) and make the visual claim of a massive problem. Arguably the topic of the map is less the location of the dots, than is their sheer number and the amount of red in the map. From the view on the map, Taylor argues, “there can be but one opinion that the present public-house system is wholly inconsistent with our civilization and our Christianity” (Taylor 1860, p. 9).
Over the following decades, maps like this become more frequent and more elaborate with London and New York as the two cities attracting the most interest – though there are a number of maps of secondary cities in these countries. Frequently, publications by activists from the temperance movements and social reformers are accompanied by maps. In 1884 the National Temperance League publishes a map very similar to Taylors map, only to make the message even more clear by giving it the title “The Modern Plague of London” (National Temperance League 1884) and leaving out the population statistics. This map represents London as a contaminated space and thus it is not surprising, that those maps drew their inspiration from earlier disease maps. Henry William Blair’s “The Temperance Movement: or, The Conflict Between Man and Alcohol” (Blair 1888) not only makes far reaching claims about pauperism, alcohol and crime but also contains a dot-map of New York similar to Taylors map, showing the location of more than 9,000 “saloons or places where liquor was obtainable” (Blair 1888, map) and Robert Graham’s “Liquordom in New York City” (Graham 1883) presents the reader with a number of large scale maps showing those New York neighbourhoods “Where Lager Reigns“ and those „Where Whiskey Reigns“ (Graham 1883). In both cases New York city stand is for the whole of the country and “the hope of the republic” depends on this city’s battle against this “most dangerous evil” (Blair 1888, pp. 362–363)
Joseph Rowntree and Arthur Sherwell’s “The Temperance Problem and Social Reform” (Rowntree and Sherwell 1899) not only contains a “Map Showing Number of Public Houses in a District of Central London” but also a choropleth map similar to the earlier map by Dupin, making claims about “Geographical Distribution of Drunkenness” in England.
While most of these maps do little more, than locating alcohol by visualizing places where alcohol is sold other maps have more dimensions in the sense that they add more spatialized variables that support each other. William Thomas Stead’s “If Christ came to Chicago! A plea for the union of all who love in the service of all who suffer” (Stead 1894) for example, opens with a famous red and black map of the Nineteenth Precint of the First Ward of Chicago, juxtaposing places of social and moral plight by marking brothels in red, saloons in black and pawn brokers and lodging houses in grey. While the journalist and social reformer Stead notes, that this is not an average precinct, the map “presents in an aggravated form most of the evils which are palpably not only in accord with the mind of Christ” (Stead 1894, p. 124), those two city-blocks in his book stand in for of the whole City of Chicago.
In contrast to the scandalizing depiction of maps und books like the one by Stead and most of the maps from the temperance movement, Charles Booth’s “Map showing Places of Religious Worship, Public Elementary Schools. And Houses Licensed for the Sale of Intoxicating Drinks”
Charts, images and maps played an important role for Booth, most famously his “Map Descriptive of London Poverty”
Alcohol is no stranger to the moral geographies of Booth’s London and many of his descriptions of the lower classes, especially in the more ethnographic description of poor families and the lower classes highlight the social and moral role of drinking. The governing of public-houses and licensing is discussed at great length as are the changing role and presence of drunkenness and drink in public life and public space. And while not a teetotalist and recognizing the social roots of drinking
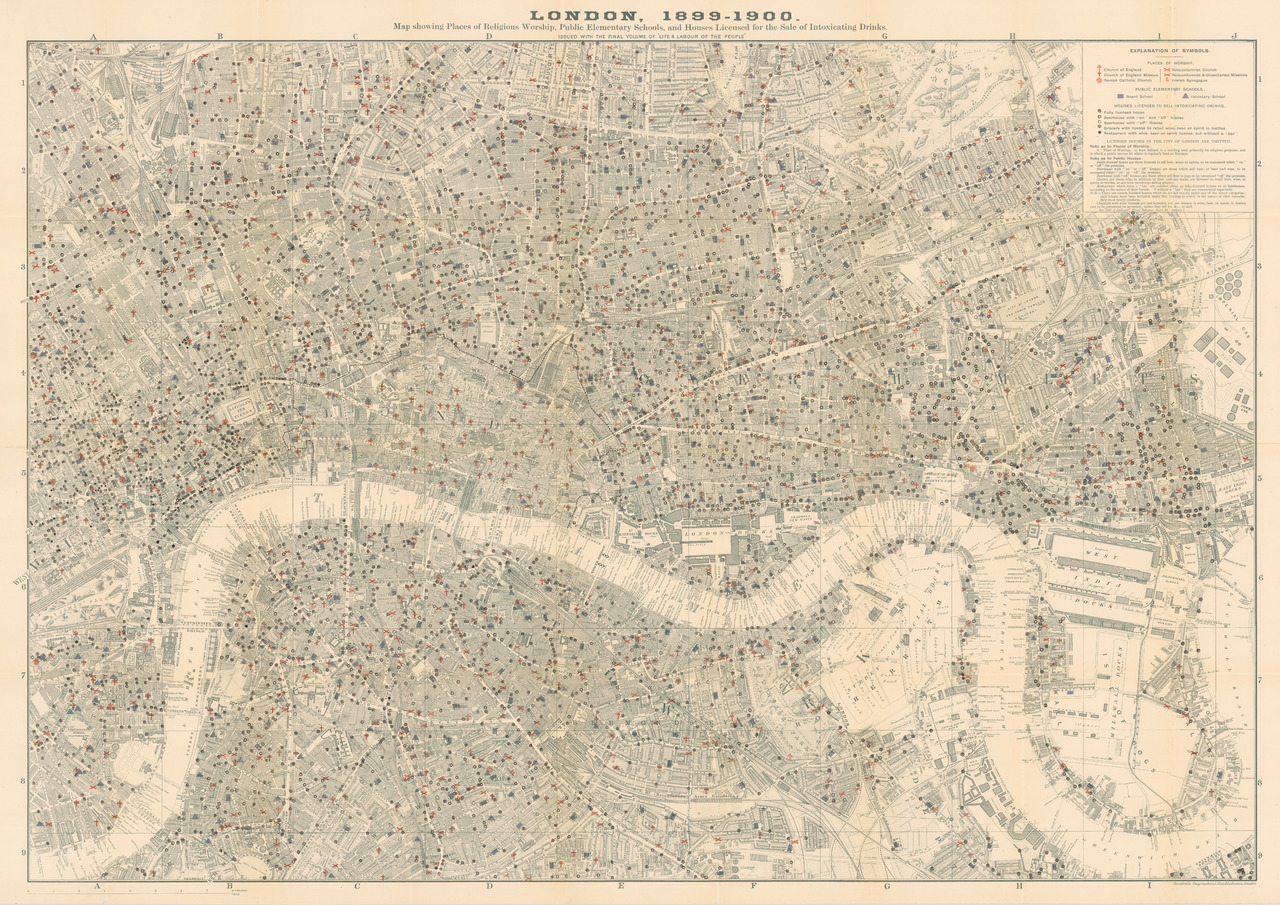
Compared to the maps on poverty and class, Booth’s mapping of alcohol received much less attention. The following map was produced for the Paris Exhibition of 1900 and published alongside the final volume of “Life and Labour of the People in London”. Similar to earlier maps, it shows “Houses Licensed for the Sale of Intoxicating Drinks”. But not only are there five different categories of those places, from fully licensed houses to “Beerhouses”, grocers with license to licensed restaurants, but also places of worship (in six different categories) and public elementary schools (in two categories). The map very clearly speaks the language of modern professional cartography. Juxtaposing these three separate types of places and the social practices associated with them is more than just, as Booth argues, “to give to the ordinary reader, at a glance, an impression of the ubiquitous and manifold character of the three most important social influences.”
Map of London Pubs, Churches & Schools1903
Map showing Places of Religious Worship, Public Elementary Schools, and Houses Licensed for the Sale of Intoxicating Drinks.
Booth, Charles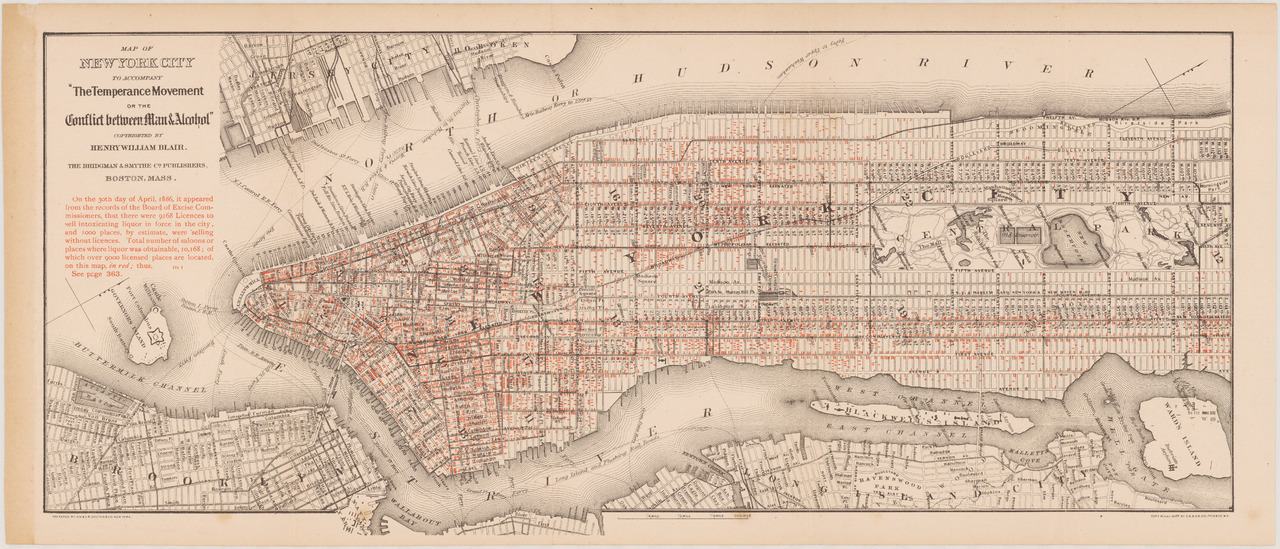
Map of New York City to accompany 'The Temperance Movement or the Conflict between Man & Alcohol'1988
On the 30th day of April, 1886, it appeared from the records of the Board of Excise Commissioners, that there were 9168 Licences to sell intoxicating liquor in force in the city, and 1000 places, by estimate, were selling without licences.
Blair, Henry William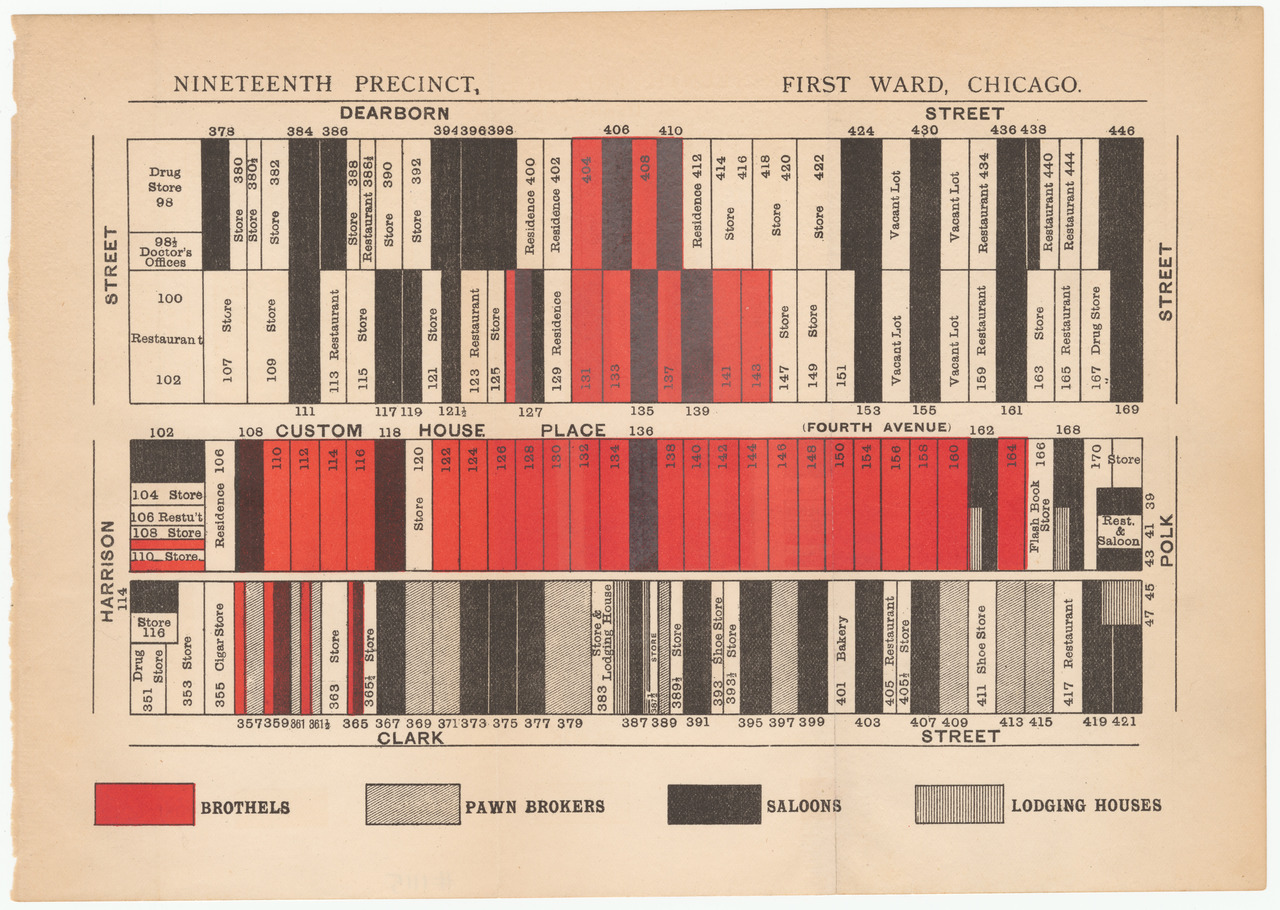
If Christ came to Chicago! A plea for the union of all who love in the service of all who suffer1894
Map from William Thomas Stead’s “If Christ came to Chicago!, showing brothels, saloons, pawn brokers and lodging houses in Chicago's 19th precinct.
William Thomas Stead Map of London Pubs, Churches & Schools1903
Map showing Places of Religious Worship, Public Elementary Schools, and Houses Licensed for the Sale of Intoxicating Drinks.
Booth, Charles If Christ came to Chicago! A plea for the union of all who love in the service of all who suffer1894
Map from William Thomas Stead’s “If Christ came to Chicago!, showing brothels, saloons, pawn brokers and lodging houses in Chicago's 19th precinct.
William Thomas Stead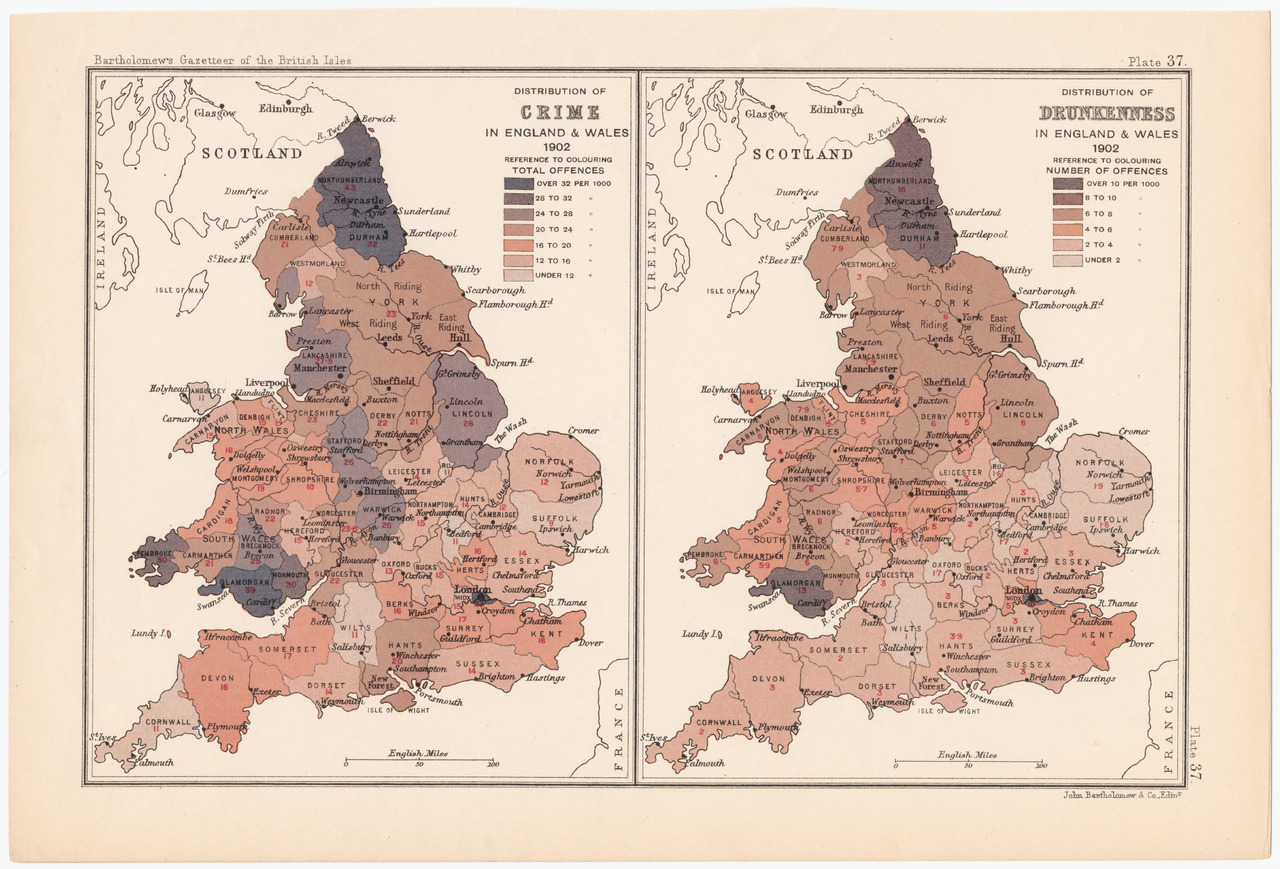
Distribution of Crime & Drunkenness in England & Wales1902
A map of the distribution of Crime & Drunkenness in England & Wales with coloured labeling of offences.
John Bartholomew